
How to Understand Eye tracking Data?
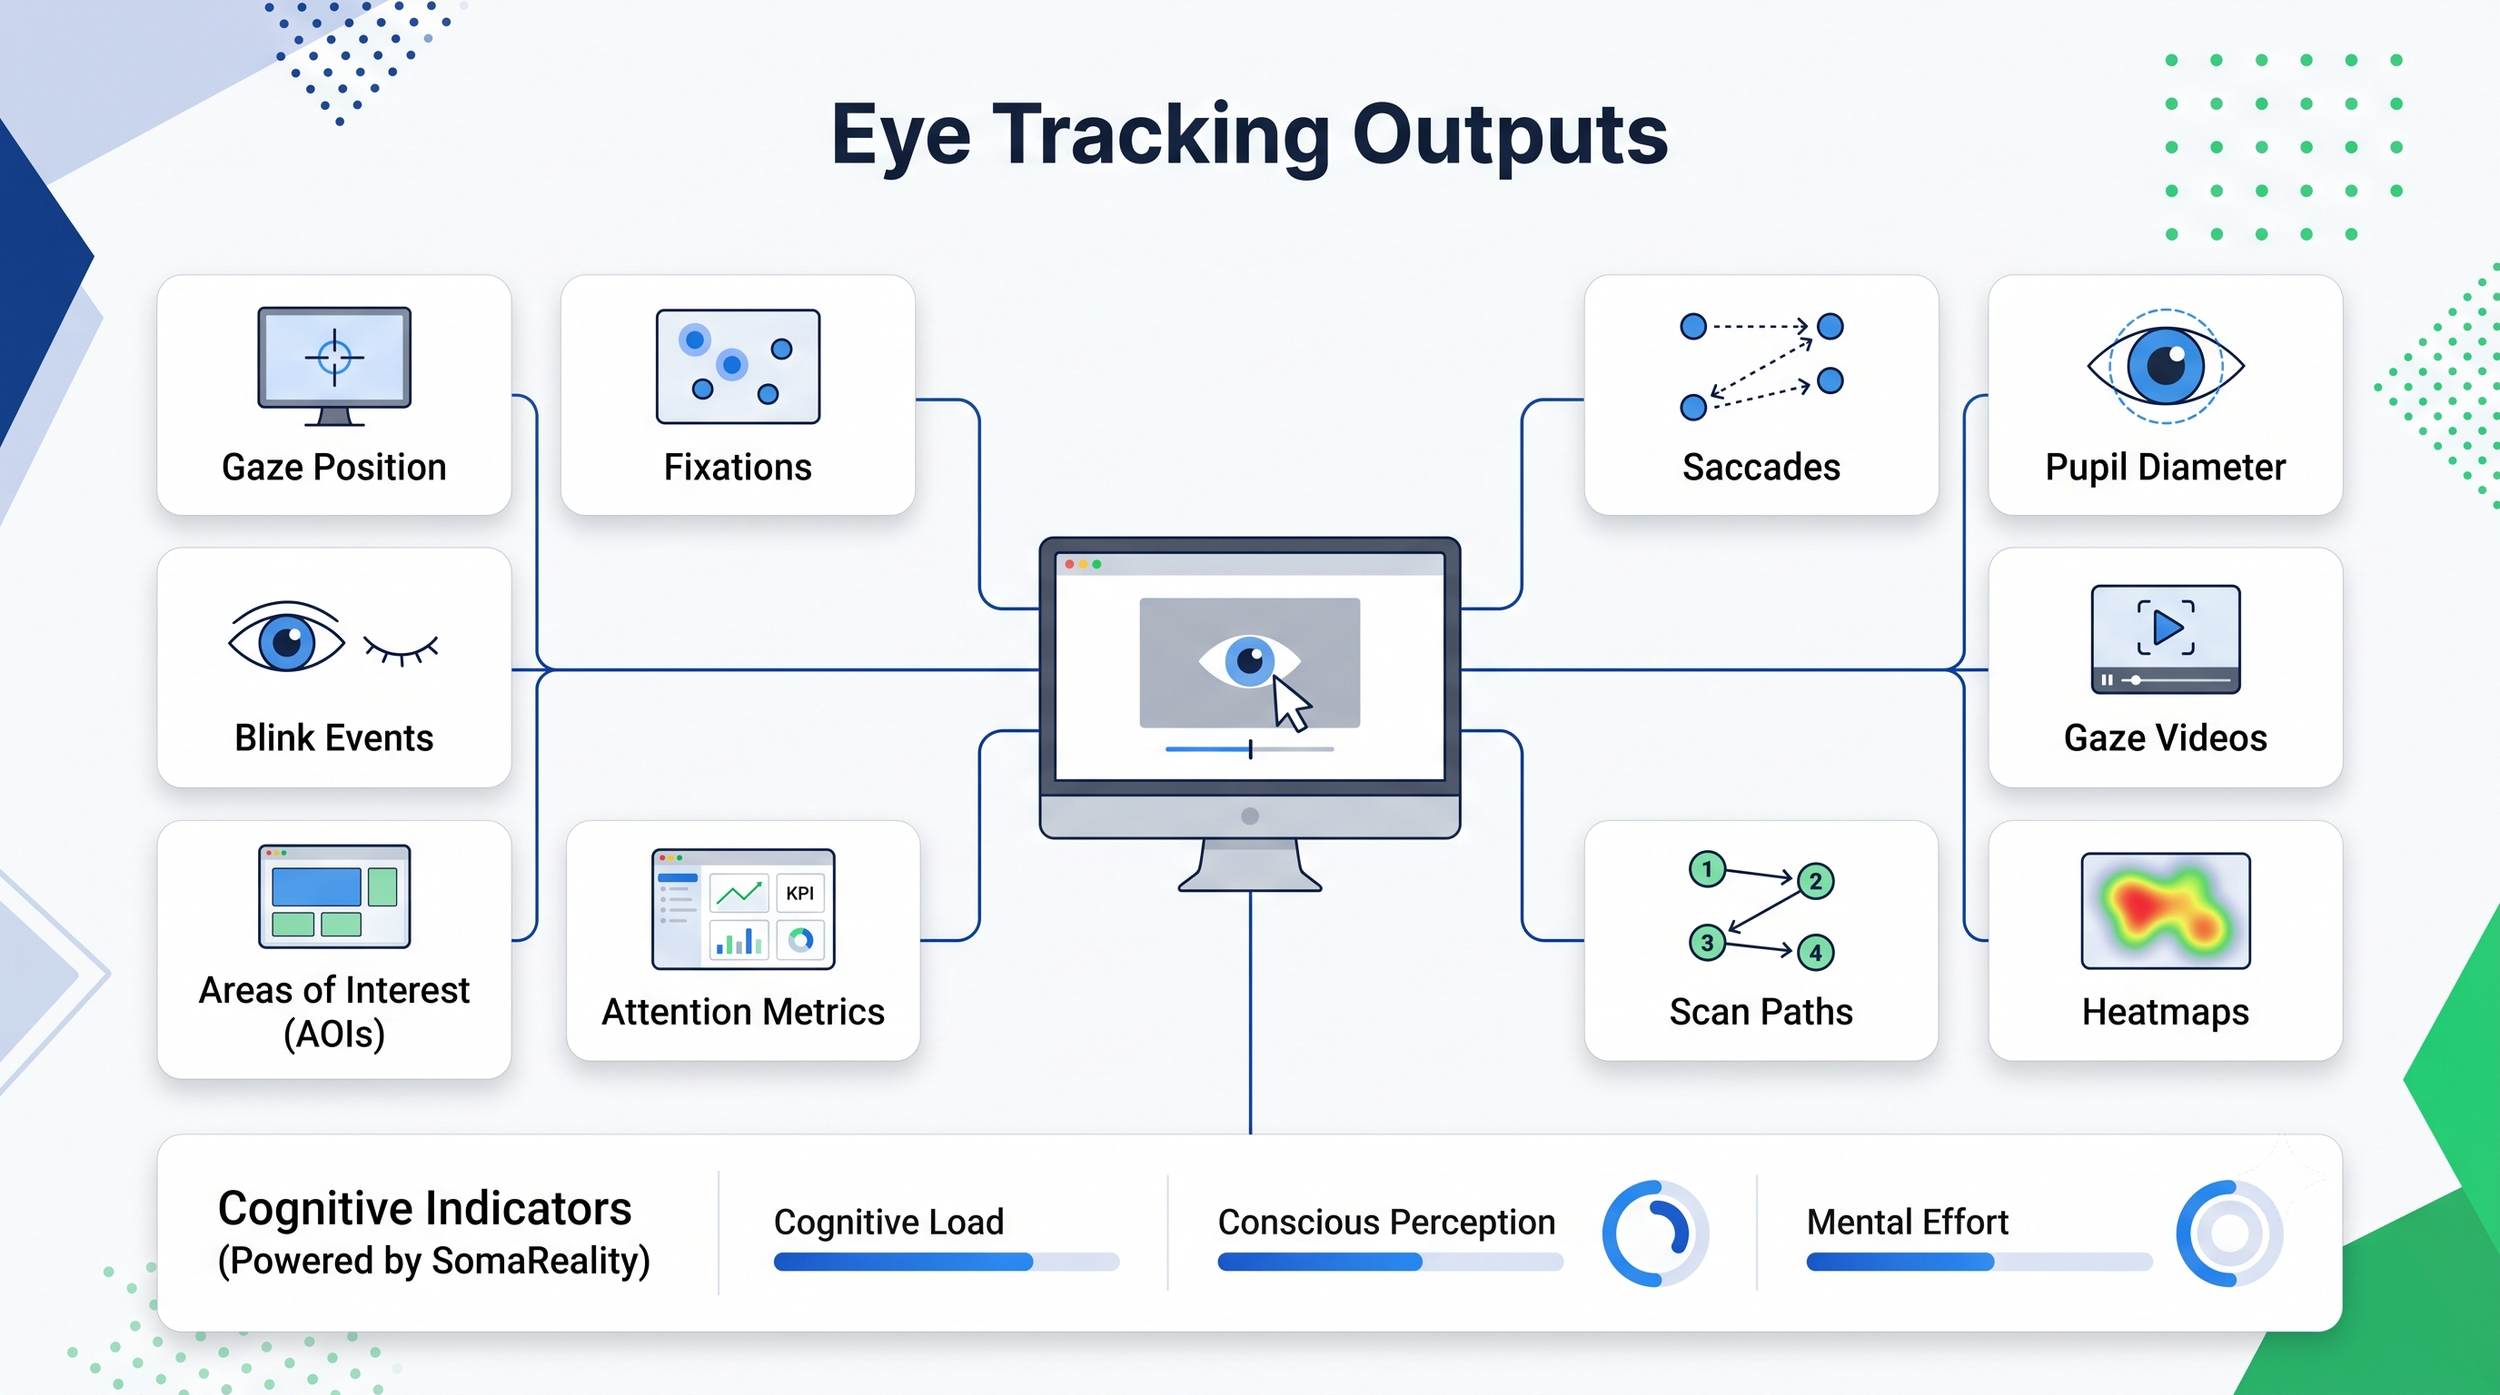
Eye tracking studies generate a rich set of data that helps researchers understand visual attention and user behavior. Using Tobii Pro Lab, this data can be visualized and analyzed through several complementary tools.
Heatmaps - aggregated view of where participants looked the most.
Gaze plots - sequence of fixations and saccades.
Areas of Interest (AOIs) - how participants move their gaze between predefined areas.
Fixation statistics - objective measures of attention and engagement like - fixation count, fixation duration, dwell time, visit count, and Time to First Fixation (TTFF).